|
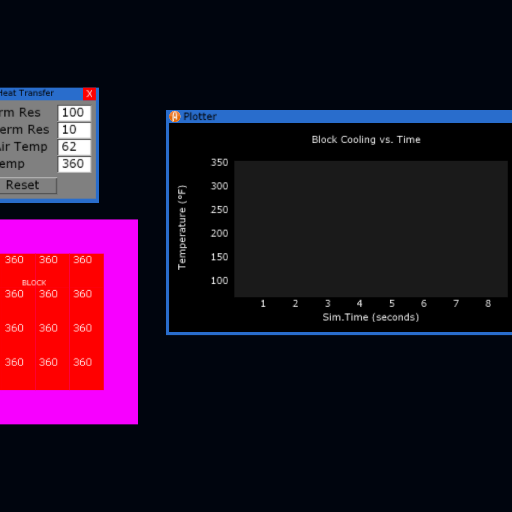
Title: Heat Transfer with Thermal Expansion
Rating: 6.5
Filesize: 0.66 MB
Downloads: 1351
Comments: 4
Ratings: 4
Date added: 2013/04/30 00:08:17
Made with: Algodoo v2.1.0
Rating: 
|
Title: Lumped System Heat Transfer
Rating: 5
Filesize: 66.77 kB
Downloads: 544
Comments: 2
Ratings: 1
Date added: 2022/10/30 10:29:02
Made with: Algodoo v2.1.0
Rating: 
|
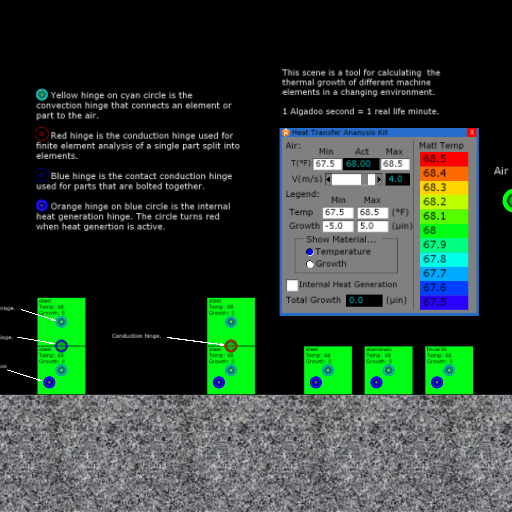
Title: Heat Transfer Analysis Kit
Rating: 5
Filesize: 490.37 kB
Downloads: 428
Comments: 7
Ratings: 1
Date added: 2022/11/13 15:27:19
Made with: Algodoo v2.1.0
Rating:
|
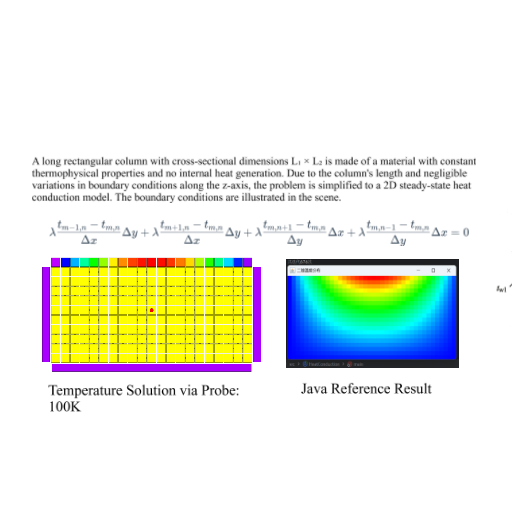
Title: Heat Conduction Problem Solved by Lasers
Rating: 5
Filesize: 299.34 kB
Downloads: 387
Comments: 1
Ratings: 1
Date added: 2025/11/16 07:49:17
Made with: Algodoo v2.2.3
Rating:
|
Title: Marble Camp Season 1 Heat 1 Update 11
Rating: 5
Filesize: 0.98 MB
Downloads: 273
Comments: 4
Ratings: 1
Date added: 2015/07/05 11:43:44
Made with: Algodoo v2.1.0
Rating:
|
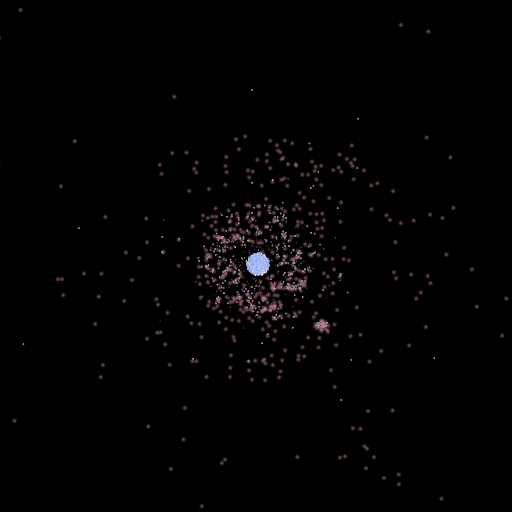
Title: heat solarsystem
Rating: 5
Filesize: 305.37 kB
Downloads: 127
Comments: 0
Ratings: 1
Date added: 2026/03/19 02:09:14
Made with: Algodoo v2.2.4
Rating:
|